

Machine Learning Monitoring — What, Why, Where, and How?
Machine Learning Monitoring — What, Why, Where, and How?
Making sure you have a healthy model making the right predictions

So you’ve deployed your model and it is now processing the requests and making predictions on live data. That’s great! But you are not done yet. Like any other service, you need to monitor your model. But monitoring a model is not the same as monitoring any other service. This article will try to explain Why you need to monitor your model, What metrics you need to monitor, Where monitoring fits into the Machine Learning Lifecycle and How do get started with monitoring your models.
Why do we need monitoring?

Anyone who has a service running in production needs to be monitored to make sure that the service is healthy (running and processing requests without unexpected errors).
But machine learning monitoring is different. A model serving can fail without making any noise. The service will be up, running and processing requests. This happens when the quality of predictions gets bad.
But why does this happen? We trained a model to have a good accuracy before moving it to production. This happens because data “drifts” over time. The distribution of data the model was trained on might end up being different from what it encounters in production. Sometimes the model might also become stale. This happens when the model’s environment shifts or changes.
We saw this a while back. When Covid-19 and lockdowns hit the world, the behaviour and shopping patterns of people around the world changed. This meant the models used by e-commerce and similar websites were encountering data that was very different from what they were trained on. This mean they might be making predictions and recommendations that are not very relevant.
Data drift and stale models are one of the many reasons for why we need Machine Learning Monitoring. Some other reasons that make Machine Learning Monitoring essential are — Failure in data dependencies, feature unavailability, and negative feedback loops.
What metrics should you monitor?
There are two ways to do Machine Learning monitoring — Setting up dashboards for realtime monitoring and have jobs that run periodically to calculate the necessary metrics. In both these cases, the metrics you monitor are generally the same.
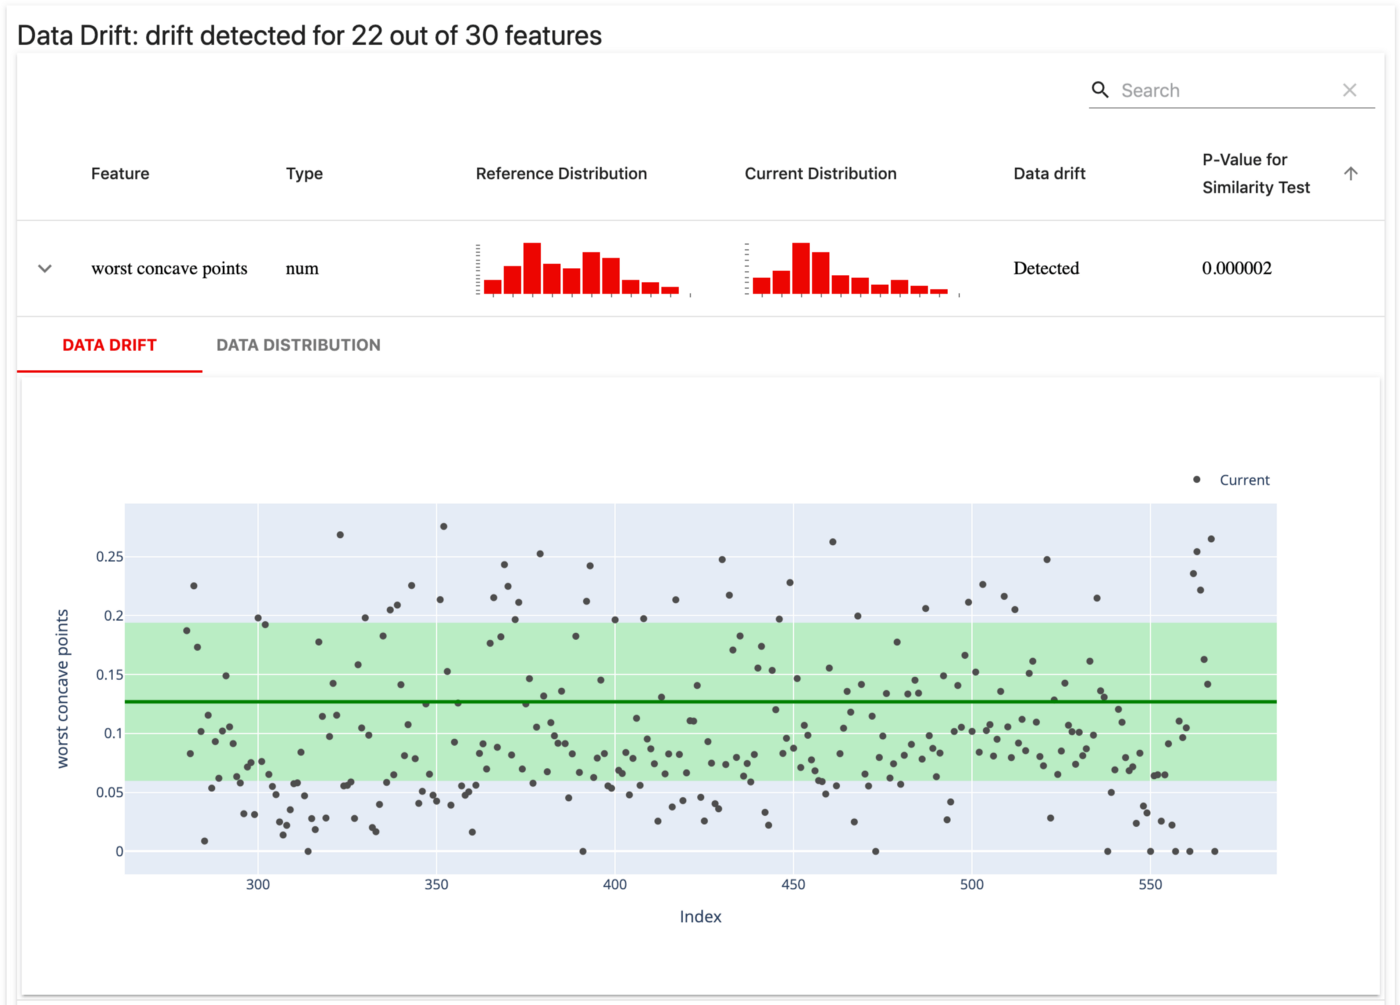
To monitor Data drift, you can plot data distribution of the training data and the data the model encounters in production, compare the two to identify data drift. If you want to automate this a bit, you can measure the p-value and use it to identify drift
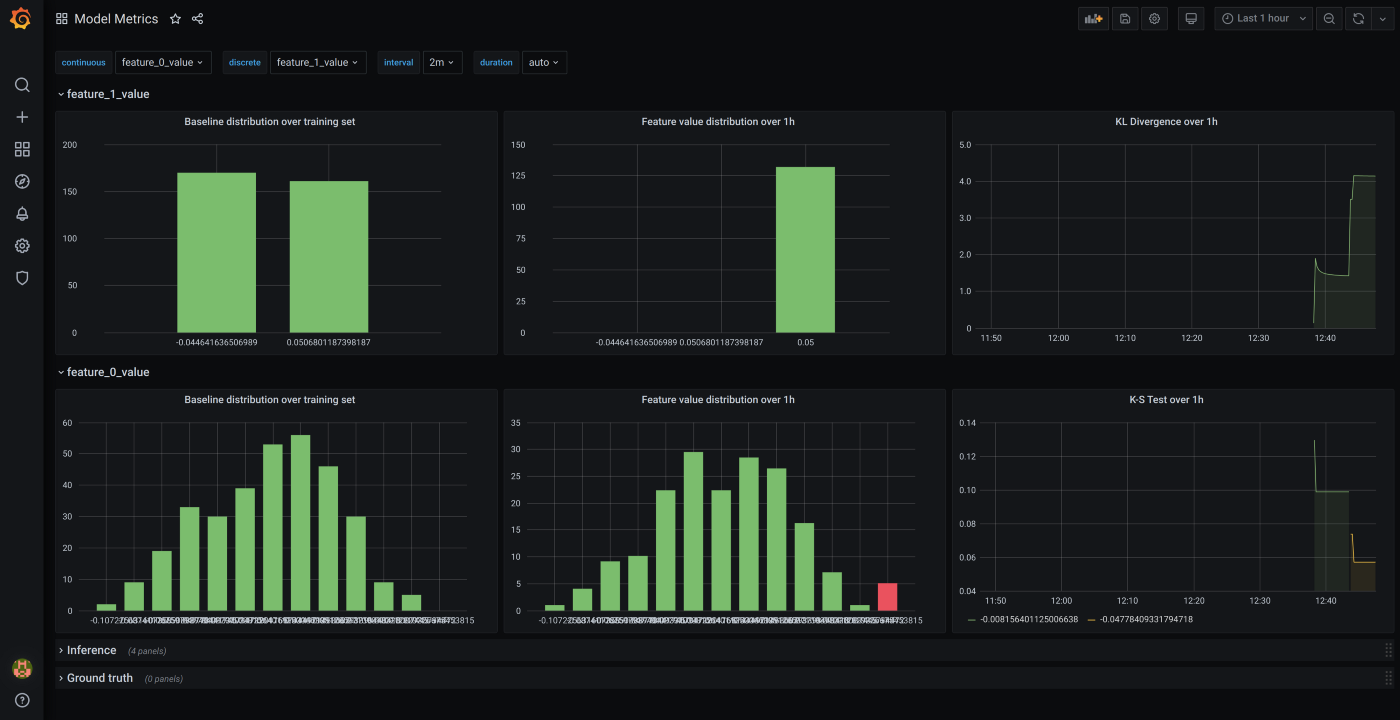
Other metrics to measure drift are Kullback-Leibler divergence and Kolmogorov-Smirnov test.
Kullback-Leibler divergence is a measure of how two distributions are different from each other. Learn more here.
Kolmogorov-Smirnov test is a nonparametric test of the equality of continuous, one-dimensional distributions that can be used to compare a sample with a reference distribution or compare two samples. Learn more here.
In most cases, understanding how you data changes over time should help identify a lot of the issues with your model.
Where does monitoring fit into the Machine Learning Lifecycle?

As mentioned in the start of this post, you start monitoring your models once it is live in production. You can set up alerts for the metrics you measure so you can be notified when your model needs retraining or some help from you.
How do I start monitoring my models?
There are many libraries and frameworks to help you monitor your models. A comparative summary can be found here.
I have experimented with Boxkite and Evidently.
Evidently is useful to generate periodic reports for your data. It can give a report in the form of a Dashboard (html page) or as a json.
Evidently can be used not only for dashboarding, but can also be integrated into your prediction pipelines. It works with Airflow, MLflow and recently they’ve added a Grafana integration too: https://evidentlyai.com/blog/evidently-and-grafana-ml-monitoring-live-dashboards.
Boxkite is great for realtime dashboards. You can have to expose an endpoint that prometheus uses to fetch the metrics which are then used in Grafana to create dashboards and alerts. It can also be used with Kubeflow and MLFlow.
Machine Learning monitoring is essential to making sure you have a healthy and useful model serving predictions to your users and can help you identify any issues with your model before it has a significant impact on your users.